An economic moat—a term made famous by Warren Buffett—describes a company’s ability to maintain a sustainable competitive advantage over time. Whether through brand power, scale, or switching costs, companies with wide moats tend to dominate markets and deliver outsized returns.
But how can investors systematically identify such companies? In Business, “Your margin is my opportunity.” Yet what if we flipped the lens—what if margins were the opportunity? In investing, they are. Not all businesses with scale or vision endure. But those with a durable economic moat—defined by sustained profitability and competitive defensibility—often do.
Here’s what we’ve learned from a deep-dive into S&P Dow Jones Indices’ latest research on the S&P 500 Economic Moat Index: it’s now possible to identify moat-worthy companies without romanticism. Without anecdotes. Without founder worship.
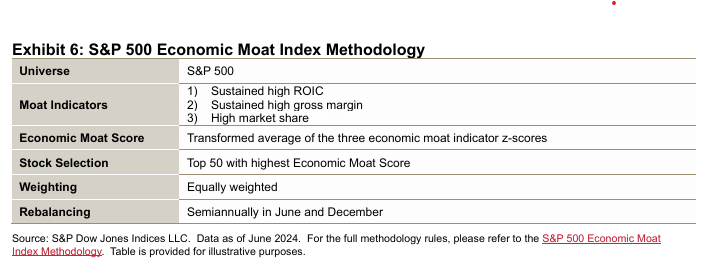
The S&P 500 Economic Moat Index, launched in 2024, provides a data-driven framework to uncover these hidden gems. Using objective, quantifiable metrics like return on invested capital (ROIC), gross margin, and market share, the index takes the guesswork out of moat identification.
Key Metrics That Define an Economic Moat
What’s A Moat, Really?
An economic moat isn’t just a nice brand or a big market cap. It’s a measurable ability to defend profits over time. S&P’s research defines it with three metrics:
- Sustained High ROIC
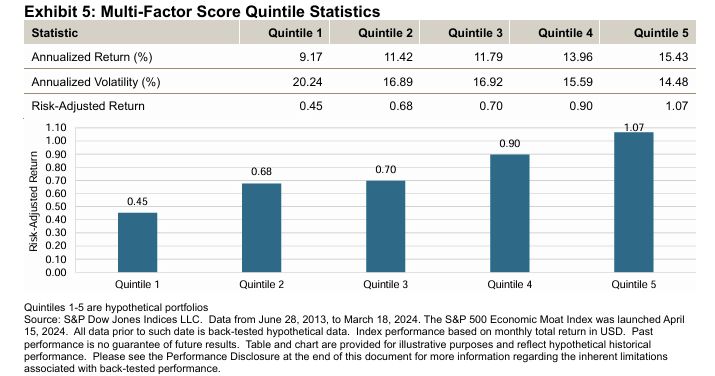
Companies that consistently earn high returns on invested capital (ROIC) tend to be protected from commoditization. Quintile 5 companies delivered 14.38% annualized returns, significantly better than their peers. → Morgan Stanley’s paper on ROIC - Stable Gross Margins
Pricing power reveals itself in gross margins—especially when those margins are consistent. The top cohort in margin stability and magnitude yielded 14.02% annualized returns with the lowest volatility. → Read: Exploring Pricing Power - Dominant Market Share
Companies that lead their industries—by brand, cost, or network effects—tend to stay ahead. Quintile 5 market-share leaders returned 14.64% annually, with the best risk-adjusted returns in the sample. → Network Effects in Action
How the S&P 500 Economic Moat Index Works
The index ranks companies on a combined score of the three metrics. It selects the top 50 from the S&P 500, equally weights them to avoid concentration, and rebalances semi-annually.
This approach offers:
- Higher risk-adjusted returns (1.10 vs 0.91 for the S&P 500)
- Lower drawdowns during market stress (e.g., COVID crash)
- Strong performance during moderate-to-high volatility regimes
Why This Matters for Investors
Investors often chase narratives or brand names. But identifying a true economic moat requires discipline and data. S&P’s model replaces bias with measurable indicators and has outperformed across multiple market cycles.
Key Takeaways:
- Economic moats are measurable through ROIC, margin, and market share.
- Multi-factor approaches outperform single-metric screens.
- The S&P 500 Economic Moat Index offers a practical, back-tested method for long-term investors.
Moats aren’t mythical anymore. They’re measurable. If you’re building or managing portfolios with a long-term orientation, identifying companies with structural advantages should be a priority. The S&P 500 Economic Moat Index provides a useful, rules-based model to screen for them.
In an age of noise and narrative, this framework helps anchor portfolios to businesses with enduring strength.
Disclaimer: Nothing here should be considered investment advice. All investments carry risks, including possible loss of principal and fluctuation in value. Finomenon Investments LLC cannot guarantee future financial results.